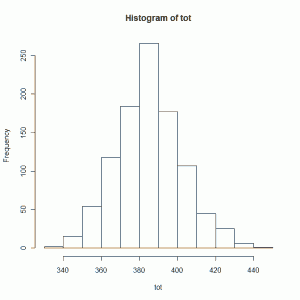
The Central Limit Theorem is really amazing if you think about it. It says that the sum of a large number of independent random variables will be approximately normally distributed almost regardless of their individual distributions. Now that’s a mouthful and perhaps doesn’t sound terribly amazing. So let’s break it down a bit. “A large number of independent random variables” means any random variables from practically any distribution. I could take 6 observations from a binomial distribution, 2 from a uniform and 3 from a chi-squared. Now sum them all up. That sum has an approximate normal distribution. In other words, if I were to repeatedly take the observations I stated before and calculate the sum (say a 1000 times) and make a histogram of my 1000 sums, I would see something that looks like a Normal distribution. We can do this in R:
# Example of CLT at work
tot <- vector(length = 1000)
for(i in 1:1000){
  s1 <- rnorm(10,32,5)
  s2 <- runif(12)
  s3 <- rbinom(30,10,0.2)
  tot[i] <- sum(s1,s2,s3)
}
hist(tot)
See what I mean? I took 10 random variables from a Normal distribution with mean 32 and standard deviation 5, 12 random variables from a uniform (0,1) distribution, and 30 random variables from a Binomial (10,0.2) distribution, and calculated the sum. I repeated this a 1000 times and then made a histogram of my sums. The shape looks like a Normal distribution, does it not?
Now this is NOT a proof of the Central Limit Theorem. It's just evidence of its truth. But I think it's pretty convincing evidence and a good example of why the Central Limit Theorem is truly central to all of statistics.

Hi!
I have some thoughts. According to CLT, random sampling of any statistic will eventually result in normal distribution of that statistic. But why this not apply to F statistics? I did bootstrapping of F statistic on 10000 samples, and I still got skewed distribution of F statistics.
Milica, the repeated sampling of SUMS of statistics will result in an approximate Normal distribution. The following produces a skewed distribution:
hist(rf(n = 1000, df1 = 3, df2 = 15))
But the following produces something close to Normal:
hist(replicate(n = 1000, sum(rf(n = 20, df1 = 3, df2 = 15))))
Notice the difference between the two. The first is just a histogram of 1000 F statistics. The second is a histogram of 1000 sums of 20 random F statistics.
Hope that helps.